For many people, social media is used daily for entertainment, socialization, and even news consumption. It’s everywhere – and that’s a good thing for businesses seeking to grow. With over 53% of the world’s population on social media, it’s critical that your business has an effective social media strategy that helps you reach your intended audience. To help you get on track and plan your approach for the rest of the year, we’ve compiled a list of essential social media statistics so you know where to focus your marketing efforts and get the highest ROI.
Top 100 Social Media Marketing Statistics
General Social Media Statistics
- Social media platforms gained 490 million users in 2020. (Hootsuite)
Top 100 Social Media Marketing StatisticsGeneral Social Media StatisticsSocial Media Customer Behavior StatisticsFacebook StatisticsInstagram StatisticsTwitter StatisticsLinkedIn StatisticsYouTube StatisticsTikTok StatisticsSnapchat StatisticsReddit StatisticsPinterest StatisticsConclusion
- The countries that added the most social media users in 2020 were: China (+110 million), India (+78 million), the Philippines (+16 million), and Mexico (+11 million). (Hootsuite)
- 98.8% of users access social media via a mobile device. (Hootsuite)
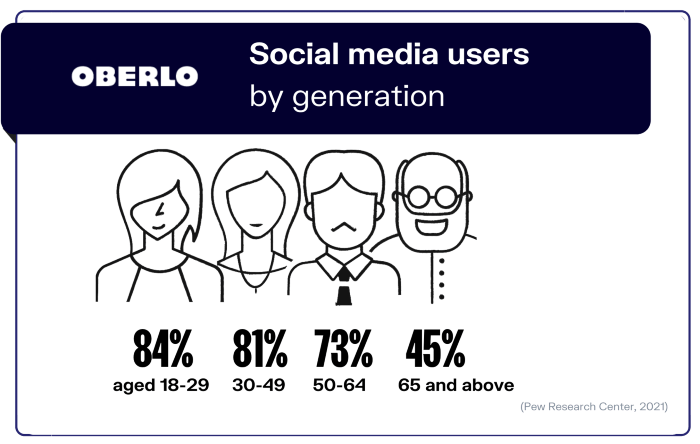
- Young adults continue to be the generation with the highest use of social media and also the broadest access to smartphones. (Oberlo)
Image Source: Oberlo 5. 44.8% of global internet users used social media to search for brand information in 2020. (Hootsuite) 6. Facebook remains the most widely used social media platform. (Pew Research Center)
Social Media Customer Behavior Statistics
The latest social media statistics in 2021 show that an average of 2 hours and 25 minutes are spent per day per person on social media. (Data Reportal)
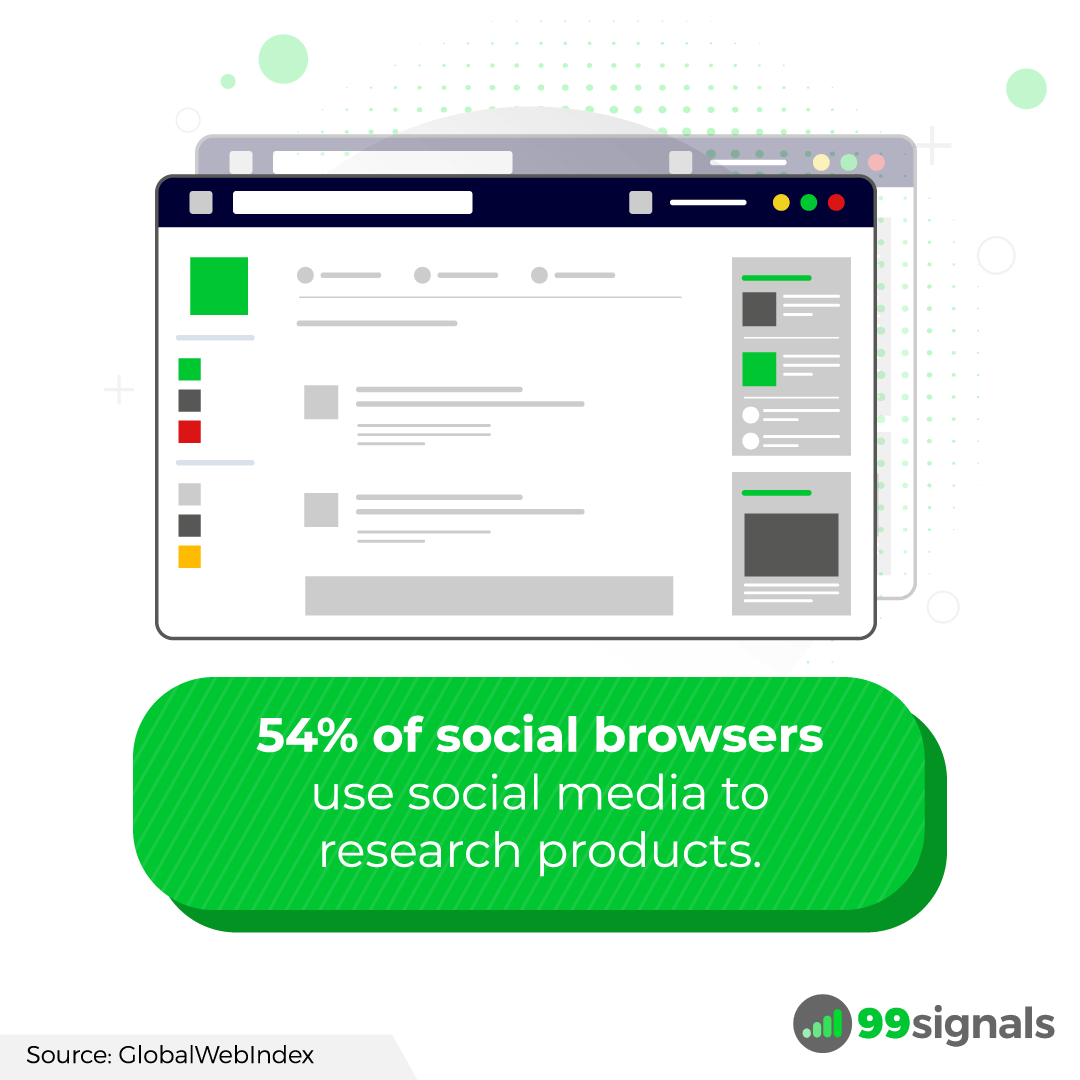
54% of social browsers use social media to research products. (GlobalWebIndex)
54% of Gen Z and 49% of Millenials say social media is their preferred channel for ad influence. (Pitney Bowes)
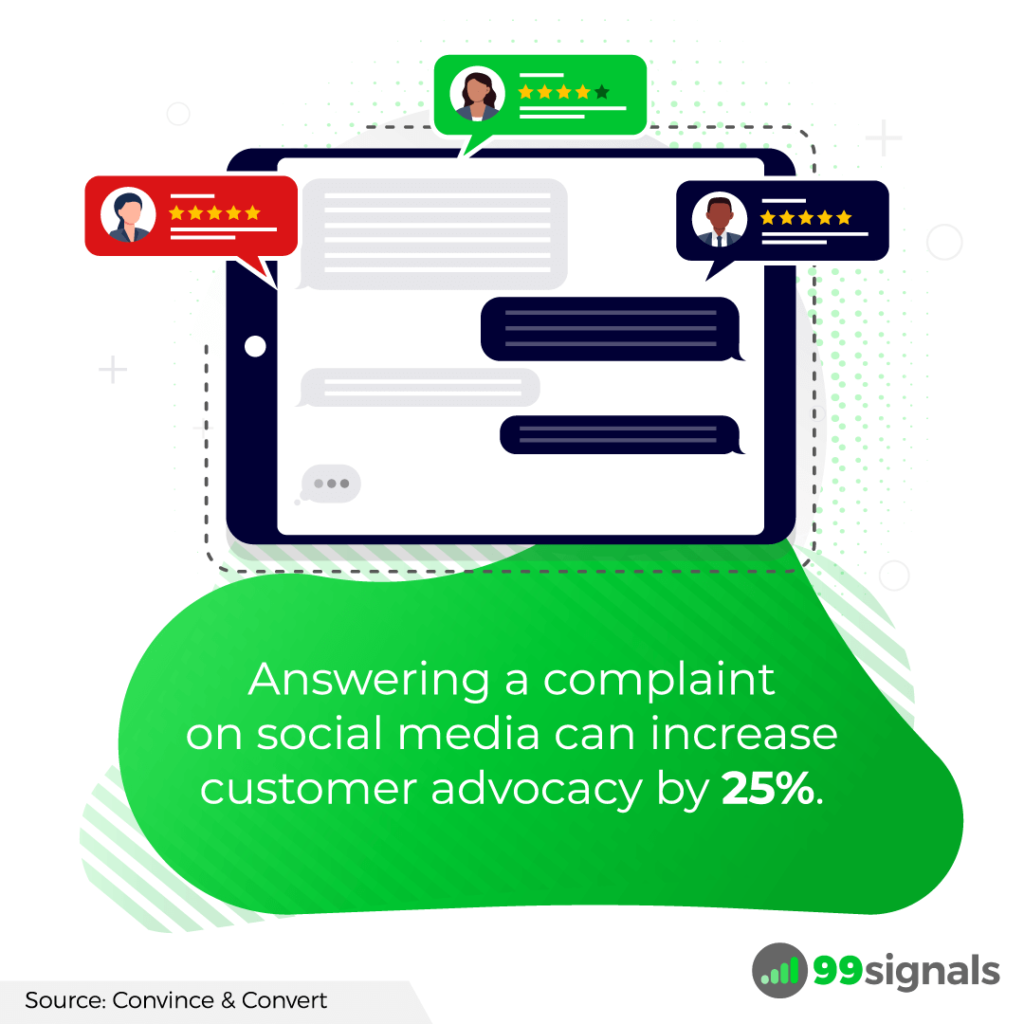
Answering a complaint on social media can increase customer advocacy by 25%. (Convince & Convert)
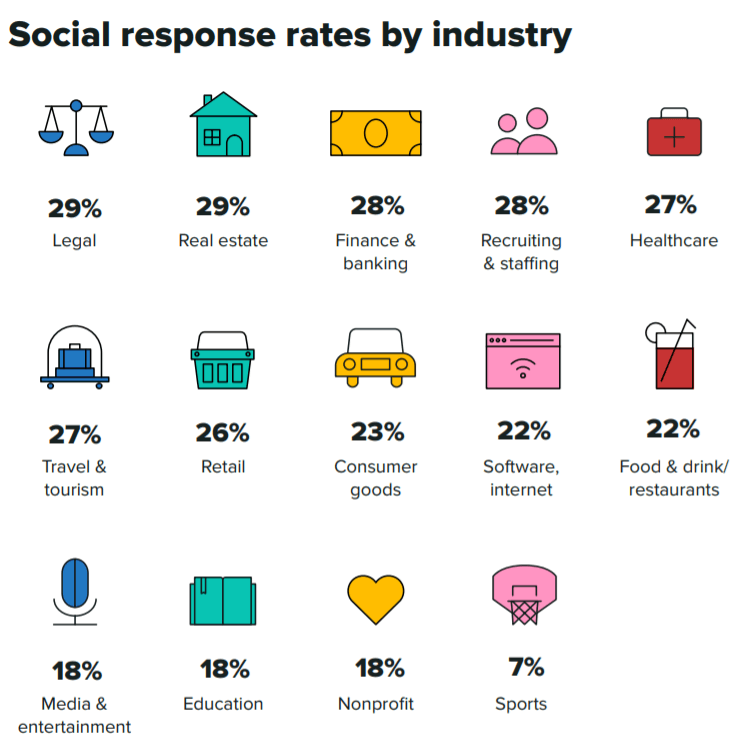
79% of consumers expect brands to respond within a day of reaching out over social media, but average brand response rates across all industries are lower than 25%. (Sprout Social)
Image Source: Sprout Social 12. 79% of people say that user-generated content on social media significantly impacts their purchasing decisions. (Stackla)
Facebook Statistics
Facebook had 1.84 billion daily active users in December 2020. (PR Newswire)
Facebook usage among teens is dropping gradually. While 71% of teens claimed to use the platform in 2015, the number has now dropped to 67%. (GlobalWebIndex)
Only 8.9% of Facebook’s audience is in the US. (Hootsuite)
98.3% of Facebook users access the platform on mobile devices. (Statista)
48.5% of B2B decision-makers use Facebook for research. (Hootsuite)
Videos drive the most ad clicks on Facebook. (DataBox)
The average engagement rate for Facebook posts is 0.18%. (Hootsuite)
Facebook Live viewership increased by 50% this spring. (Facebook)
36% of people get news from Facebook. (Digital News Report)
Facebook Stories have 500 million daily viewers. (TechCrunch)
18.3% of U.S. adults made a purchase through Facebook in the last year. (Hootsuite)
The best time to post on Facebook is Wednesday at 11 AM and 1-2 PM. Sundays show the least amount of traffic. (Sprout Social)
Instagram Statistics
It is estimated that Instagram added 26.9 million users between 2016 and 2020 — almost double the incremental users expected for Twitter, and far more than any other social platform tracked. (eMarketer)
67% of Gen Z and 57% of Millennials use the platform, in comparison to only 38% of Gen X. (GlobalWebIndex)
36.2% of B2B decision-makers use Instagram to discover and research new products. (Hootsuite)
98% of marketers say Instagram is the most influential platform for influencer marketing, which is 44% higher than Facebook. (Sprout Social)
In late 2019, Instagram Stories had 500 million monthly active users. (Statista)
90% of people on Instagram follow a business. (Instagram)
Average engagement rate for an Instagram post is 0.85% (but that goes up to 1.05% for carousel posts). (Hootsuite)
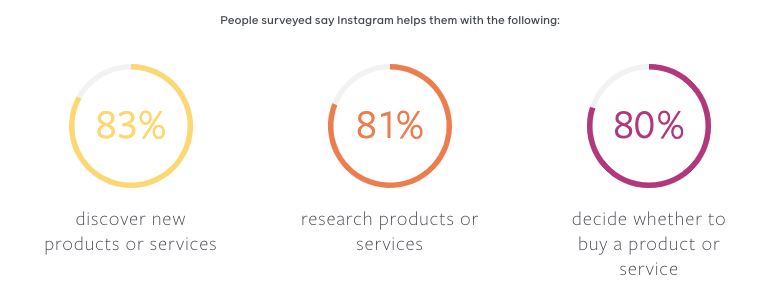
83% of people use Instagram to discover new products and services and 87% said they took specific action, like making a purchase, after seeing product information. (Facebook for Business)
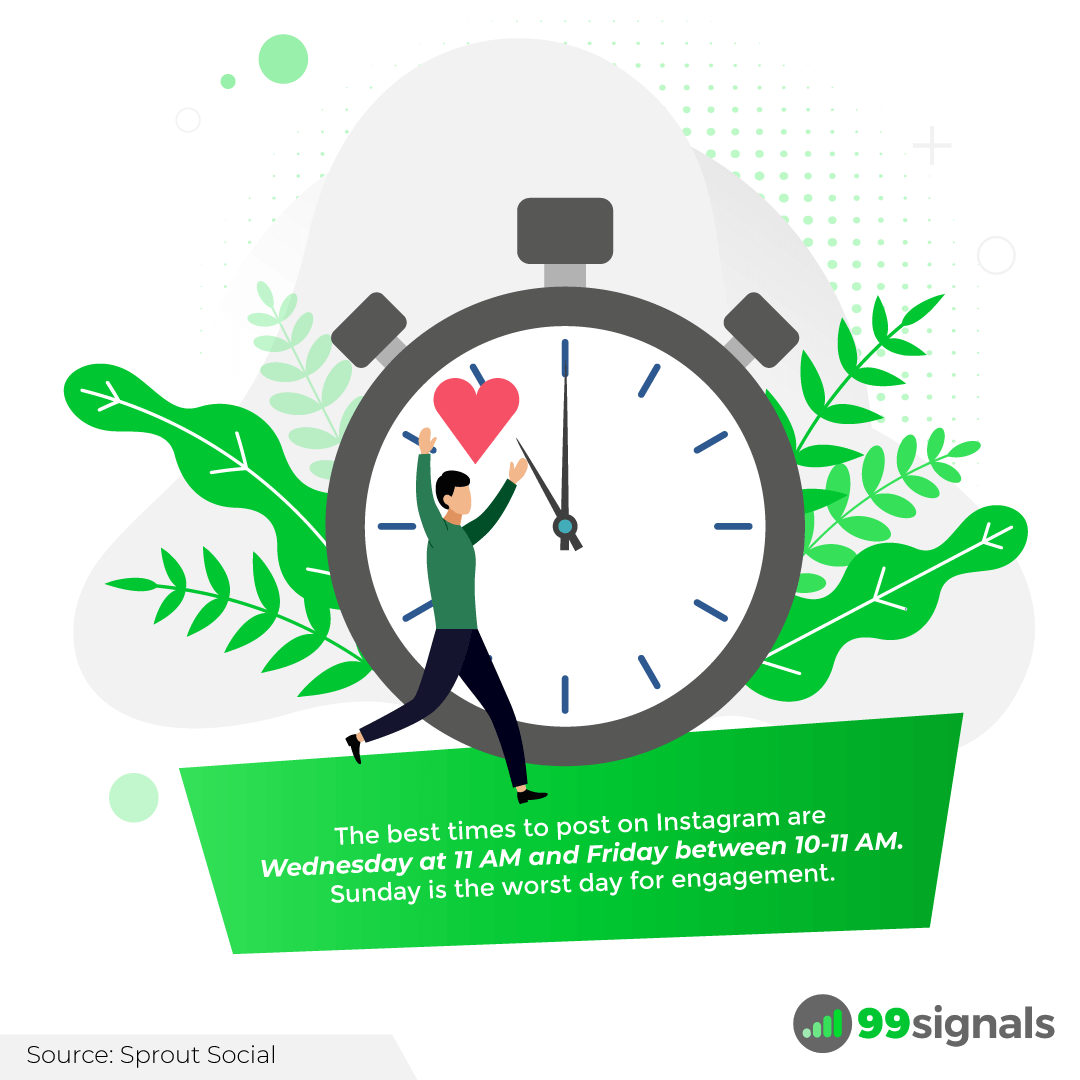
Image Source: Facebook for Business 33. Mobile-shot Stories ads outperform studio-shot ads a whopping 63% of the time. (Instagram) 34. Stories Ads that draw attention to the CTA button drive more results 89% of the time. (Instagram) 35. The best times to post on Instagram are Wednesday at 11 AM and Friday between 10-11 AM. Sunday is the worst day for engagement. (Sprout Social)
Twitter Statistics
- Twitter had more than 330 million monthly active users in Q1 of 2019. (Twitter)
- Twitter user statistics show its users are influential and affluent. (Neil Schaffer)
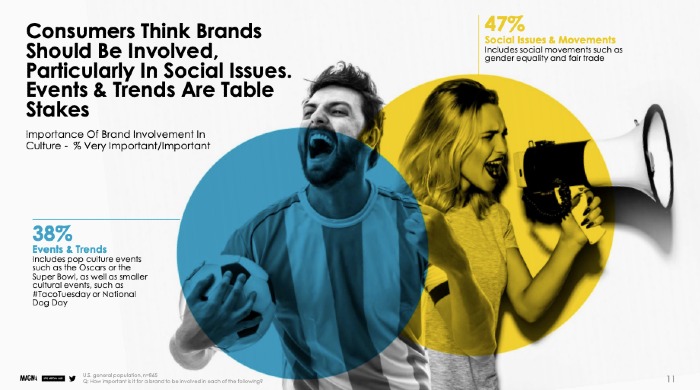
- Socially responsible ads on twitter perform 12% better than standard ads. (Magna)
Image Source: Magna 39. 93% of Twitter community members are open to brands getting involved in conversation, such as providing help and support. (Twitter) 40. 47% of American Twitter users prefer culturally relevant brands. (Business of Apps) 41. 85% of American small businesses find Twitter indispensable for customer service. Link clicks account for 92% of all user interaction with tweets. (HubSpot) 42. Average Twitter Ads ROI is 40% higher than other channels. (Twitter) 43. The best times to post on Twitter are Wednesday and Friday at 9 AM, and Saturday has the least engagement. (Sprout Social)
LinkedIn Statistics
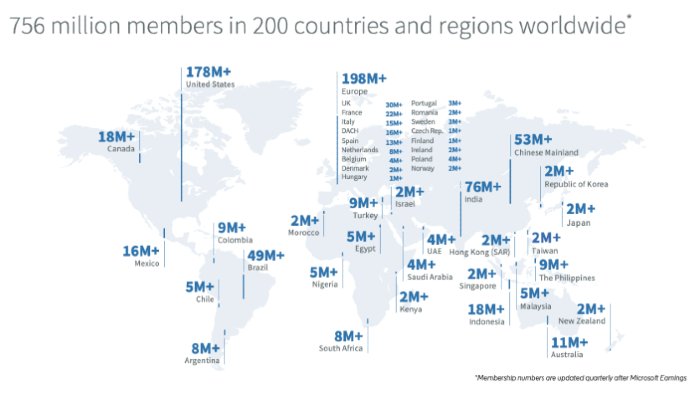
- LinkedIn has more than 722 million active users in 200 countries and regions worldwide. (LinkedIn)
Image Source: LinkedIn 45. Among the 700+ million LinkedIn members, Europe has over 198 million users. (LinkedIn) 46. As of 2019, the platform had 90 million senior-level influencers. (LinkedIn) 47. LinkedIn is the top paid and organic social channel for B2B businesses. (Content Marketing Institute) 48. 55% of decision-makers use LinkedIn content to choose companies and organizations to work with. (LinkedIn) 49. 82% of B2B markers report finding the greatest success on LinkedIn. (LinkedIn Marketing Solutions) 50. LinkedIn SlideShare has over 80 million active users. (Influencer Marketing Hub) 51. For 94% of B2B marketers, LinkedIn is the first channel they use when they want to distribute content to various social media sites. (LinkedIn Marketing Solutions) 52. Using LinkedIn’s Sales Navigator leads to a +7% higher win rate when closing deals. (LinkedIn) 53. LinkedIn gets the most social media traffic from Facebook at 35.45%. Other social sites direct traffic to LinkedIn at 21.83% (YouTube), 15.90% (SlideShare), and 12.36% (Twitter). (SimilarWeb) 54. The best times to post on LinkedIn are 8-10 AM and 12 PM on Wednesdays, and 9 AM and 1-2 PM on Thursdays. Sunday is the worst day for engagement. (Sprout Social)
YouTube Statistics
YouTube is the second-largest search engine globally. (Alexa)
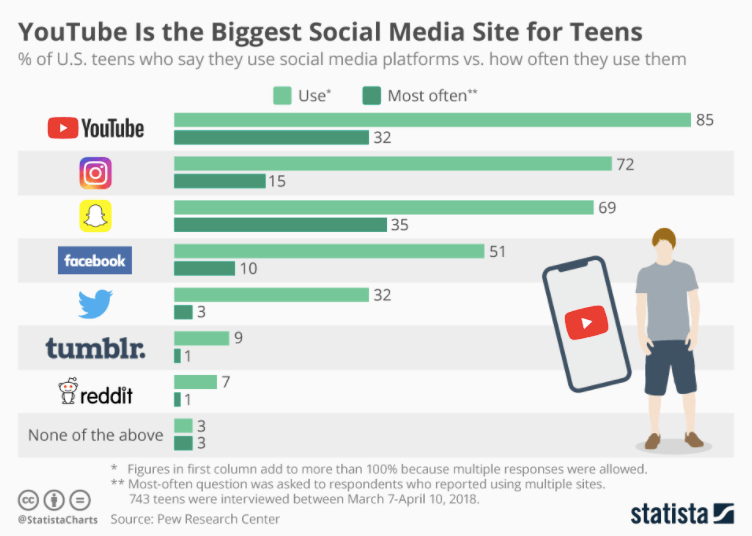
85% of U.S. teens were active on YouTube in 2019. (Statista)
Source: Statista 57. YouTube accounts for more than 25% of total worldwide mobile traffic. (Sandvine) 58. 18-to-34-year-olds use YouTube to view video content on TV, 7.9% more often than basic cable, and 14.5% more often than premium cable. (Variety) 59. Video consumption is one of the most popular ways to consume content, with 85% of U.S. internet users accessing online video through YouTube at least once per week. (Semrush) 60. 37% of viewers ages 30 to 49 use YouTube as a news source. (Semrush) 61. Fashion and beauty-related content such as makeup and skincare tutorials, clothing hauls, and product recommendations are the most popular content on YouTube. (Semrush) 62. In 2019, 29% of marketers found that pre-roll skippable YouTube video ads were considered the most effective advertising form on Youtube. (Semrush) 63. Display ads are the most effective YouTube ad marketing strategy for 10% of marketers. (Semrush)
TikTok Statistics
- In 2019, U.S. TikTok users spent more time on the app than any other social media site, with an average session duration of 10.85 minutes. (Statista)
- By February 2019, TikTok hit 1 billion downloads, beating Instagram and Facebook in app stores. (Business Insider)
- As of January 2021, TikTok has 689 million global active users. (Data Reportal)
- 41% of global TikTok users are between the ages of 16 and 24. (GlobalWebIndex)
- 90 percent of all TikTok users access the app on a daily basis. (Oberlo)
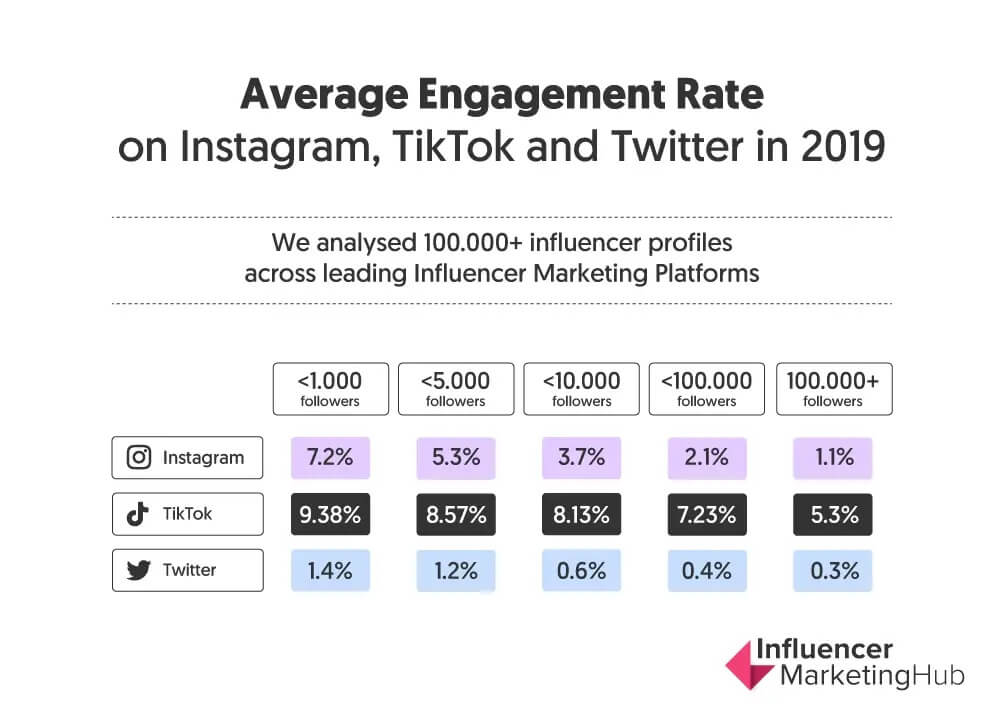
- TikTok’s average engagement rate is high at all follower levels. (Influencer Marketing Hub)
Image Source: Influencer Marketing Hub 70. TikTok is now offering ad credits for new brands advertising on the platform. There is a $300 ad credit and a $2000 ad credit. (TikTok)
Snapchat Statistics
- 498 million people use Snapchat; 265 million use it every day. (Snapchat)
- Snapchat reaches 75% of Millennials and Gen Z. (Snapchat)
- 64% of companies are on Snapchat. (Adweek)
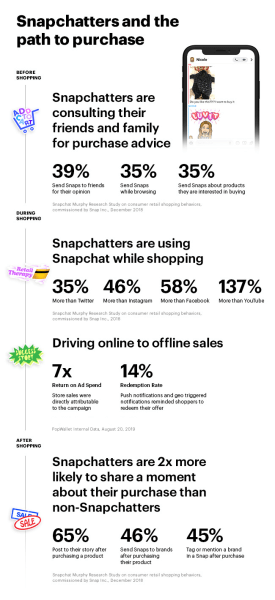
- Snapchat users are 60% more likely to make impulse purchases. (Snapchat)
- 46% of Snapchat users message brands after making a purchase. (Snapchat)
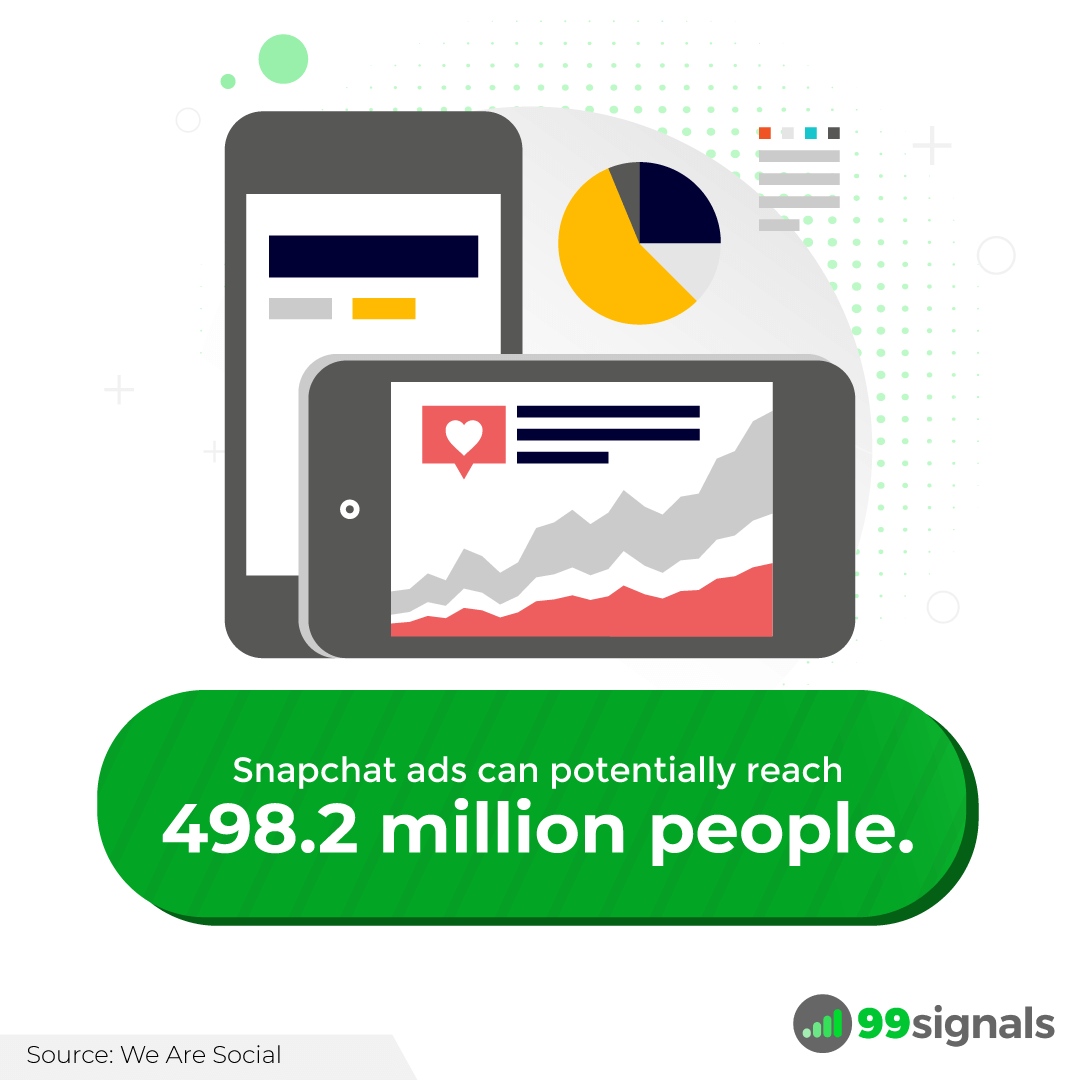
Source: Snapchat 76. 200 million users check Snap Maps daily. (TechCrunch) 77. 20% of Snapchat users check out Discover daily. (Snapchat) 78. Snapchat’s average revenue per user is $3.44. (Snapchat) 79. Snapchat ads can potentially reach 498.2 million people. (We Are Social)
Reddit Statistics
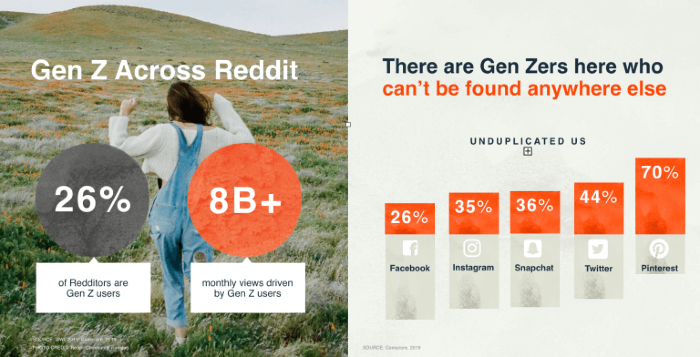
- In 2020, Reddit had 52 million daily active users, up by 44% compared to recent years. (Reddit)
- Reddit receives more than 50 billion+ monthly screen views. (Reddit)
- Gen Z makes up 26% of Reddit Users. (Reddit)
Source: Reddit 83. 44% of Reddit’s monthly active users access the site via mobile app or mobile browser. (Search Engine Journal) 84. Reddit is predominantly male. 15% of male internet users between 18 to 29 say they use Reddit. (Pew Research Center) 85. Of all technology enthusiasts online, 40% are active on Reddit, whereas 38% of all Redditors are passionate about technology (Reddit) 86. The visitors to Health and Fitness communities spend 15 times more time on subreddits. (Reddit) 87. 82% of Gen-Z people say they trust Reddit when it comes to learning more about products. (Reddit) 88. The most popular titles have more than 20 and less than 120 characters. (Foundation) 89. External links are the most appreciated type of content. (Foundation) 90. Mondays and weekends are the best times to post on Reddit. (X-cart)
Pinterest Statistics
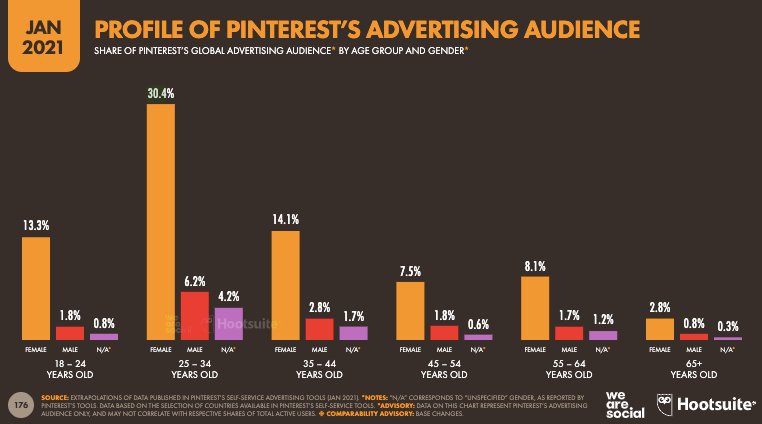
- Pinterest now has 459 million monthly active users. (Pinterest)
- The number of Gen Z users grew by 40% between 2019 and 2020. (Pinterest)
- Women aged 25-34 represent 30.4% of Pinterest’s ad audience. (Hootsuite)
Source: Pinterest 94. 82% of people use Pinterest on mobile. (Pinterest) 95. 95% of the top searches on Pinterest are unbranded. (Pinterest) 96. Pinners are 70% more likely to engage with product tags in scenes. (Pinterest) 97. Pins with “new” in overlay text lead to 9x higher aided awareness. (Pinterest) 98. Collection ads drive a 6-18% increase in total basket size. (Hootsuite) 99. 55% of people use Pinterest to shop and buy. (Social Pilot) 100. 87% of people on Pinterest have bought a product because of Pinterest, while 93% use Pinterest to plan a future purchase. (Social Pilot)
Conclusion
These social media marketing statistics can show you the state of the digital space today, where it might be going, and how you can ensure your business is continuously meeting customers where they want to be met. Use these statistics to your advantage to understand what you need to do to effectively use social media for your business today. If you found this article useful, share it on Twitter using the link below:
100 Amazing SEO Stats to Guide Your Strategy 12 Best Social Media Scheduling Tools That’ll Help You Save Time 25+ Places You Should Be Sharing Your Content 15 Best Marketing YouTube Channels (That Are Worth Subscribing To) 35 Email Marketing Stats to Shape Your Strategy