I’ve been an admirer of Fishkin’s work for a long time. Back in 2015, when I launched my own digital marketing agency, I remember binging on his Whiteboard Friday videos to level up my SEO game. And his Twitter account has been my go-to source for nuggets of business wisdom. Here’s my all-time favorite tweet from Fishkin:
— Rand Fishkin (@randfish) February 4, 2015 His memoir Lost and Founder sheds light on his business and SEO experience. It’s one of my favorite business books — a must-read for anyone looking to start or grow a business and navigate the ups and downs that come with it. Recently, Fishkin published an in-depth study comparing third-party traffic estimates with Google Analytics traffic data on the SparkToro blog. This study has generated a lot of buzz in the SEO community and the response has been mixed. While the analysis itself is commendable, the results appear to be predisposed and fail to completely eliminate biases. It is essential that when evaluating any analysis, people take a critical look at the methodology, data sources, and any potential biases. In this article, we’ll break down Fishkin’s analysis and examine why the data could be unreliable for SEO users.
Collaboration with Similarweb
For the purpose of this study, SparkToro acquired metrics from four providers of traffic estimate data — Semrush, Datos, SimilarWeb, and Ahrefs — and compared these against Google Analytics’ reported numbers. But something that’s not mentioned in the article is the fact that Fishkin and SparkToro worked closely with Similarweb on this project. As such, it’s not completely unbiased. Here’s the tweet from Fishkin which proves that: Given these potential biases and limitations, it’s important to take the results of this analysis with a grain of salt.
Flaw in the Methodology
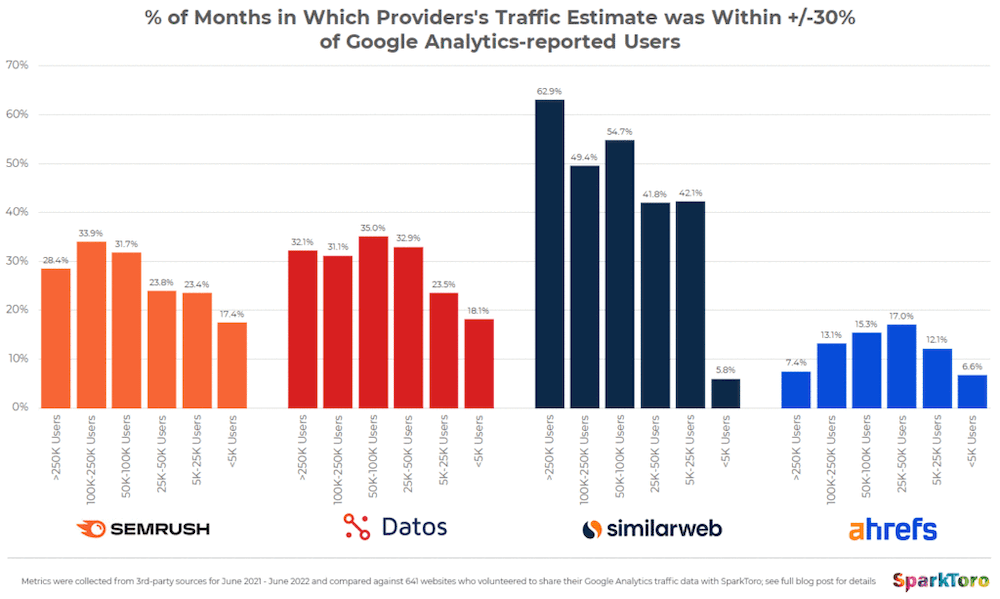
In the article, Fishkin claims that over 1,000 participants shared their websites’ Google Analytics traffic data with SparkToro. According to Fishkin: It’s not quite clear why they cleaned their dataset significantly. Did they remove all sites for which any of the tools had no data? If so, this could affect the outcome. If all the websites had been included in the research, the figures could have been different. It’s important to note that Similarweb has no data for small websites (>5k visits). This shows that the sample is biased and it’s definitely not a random set of domains. Another point of contention in the study is the lack of clarity on the kind of traffic estimates that third-party SEO tools provide. Here’s how Fishkin explains this predicament: Unlike Fishkin claims, it’s not that difficult to find the kind of traffic Semrush and Ahrefs estimate. Ahrefs estimates only organic traffic. Here’s a tweet from Tim Soulo, Ahrefs’ CTO, that validates that: Semrush, on the other hand, has two types of available data. The first is organic traffic in SEO tools, and the second is in .Trends tools. And afaik Similarweb and Semrush both give estimations for overall traffic. pic.twitter.com/GnXhd0o4ch — Tim Soulo 🇺🇦 (@timsoulo) November 22, 2022 While Semrush’s Domain Analytics makes estimations based solely on keyword positions and their estimated traffic, Traffic Analytics makes estimations by analyzing clickstream data on all sources of traffic, including search. Because SparkToro compared completely different competitors, and perhaps, different sets of data, the research methodology and analyses lack thoroughness and transparency. Furthermore, Fishkin provides no information on the countries used for this specific study. One can only assume that SparkToro was analyzing US traffic data. But then there’s the fact that worldwide data is the only default available data in Similarweb. Individual data for each country is purchased separately. As a result, it’s not clear what data was used for comparison in this study. There’s no mention of the categories/niches of the websites either. You’ll also find several charts in the study. Fishkin considers the chart below to be his favorite:
This chart shows each of the four data providers alongside the % of times their traffic metric was within 30% of Google Analytics’ reported users for the month. The websites have also been segmented based on how much traffic they receive. Now my question is: Why did Fishkin choose 30%? Why is it not 20% or 40%? What’s the idea behind the number? The reasoning behind the chosen percentage of 30% for this study appears to be subjective, with no clear explanation as to why this exact figure was selected. It’s just a random percentage specifically picked for this study. While a deviation of 30% is permissible, it is uncertain what the outcome would be if the percentage was reduced or increased. Ultimately, the answer to this question remains a mystery. Then there is this chart which shows 3rd-party traffic estimate range for 46 sites with 250k+ monthly GA users:
This chart is honestly pointless and provides no value to users. It is meant to compare data from two particular websites, showing the biggest and the smallest discrepancies based on their Google Analytics data. This method of drawing conclusions is highly unreliable, since it is based on only 46 websites – a very small sample size.
Feedback from the SEO Community
Rand Fishkin used four of the most popular SaaS SEO tools on the market for this study. As such, it was inevitable that the results would receive an abundance of feedback. And the SEO community didn’t disappoint. While some experts found the insights in the study to be useful, a large portion of the community questioned the weak methodology and the inherent bias in the study. Digital Marketer Kris Roadruck noted that the study used users as the preferred metric and not sessions or pageviews for benchmarking Google Analytics against tools that report organic visits. And then there are the comments on the article itself. One user commented on the bizarre methodology of comparing Ahrefs’ traffic data, which is insubstantial, to that of Semrush and Similarweb. — Kris Roadruck (@KrisRoadruck) November 22, 2022
Final Thoughts
While Fishkin’s study provides a few valuable insights and information, it’s essential to consider other perspectives and sources when testing the accuracy of 3rd-party traffic estimates. It’s always recommended to cross-reference the results with other tools and methodologies and not to rely solely on one source, which in this case, seems to be biased in favor of Similarweb.
11 Best SEO YouTube Channels to Level Up Your SEO Game BuzzSumo: The Ultimate Guide (18 Advanced Ways to Use BuzzSumo) 50 Best Naval Ravikant Quotes to Inspire You