Have you ever felt the need to collate data from various platforms and compare them with each other to analyze their performance? For all those involved in online marketing, the problem of data interpretation and visualization is not uncommon. We are often surrounded by a huge pile of data, from different platforms, which are hardly comparable with each other and sometimes, hard to interpret. When this is the case, business reporting becomes more complex. Also, it becomes increasingly difficult to compare your efforts and the results you are getting.
Download Now: The Ultimate Guide to Link Building – 25 Actionable Strategies to Build High Quality Backlinks [Free eBook]
Google Analytics is a great tool for data analysis, research, and data discovery. But, when it comes down to building customized dashboards for your clients, Google Analytics is not that flexible enough. It is estimated that marketers spend 10 to 30 hours a month on reporting. This time, when saved, can be used to focus on more important and interesting aspects of our clients’ accounts. This is where Supermetrics comes to the rescue. Ever since it was released as an add-on for Google Sheets, Supermetrics has been the answer to data interpretation and visualization problems. Gone are the days when marketers used to spend hours importing and preparing excel reports from Google Analytics. Supermetrics is a powerhouse business analytics tool that brings all your metrics into one place and facilitates ease of analysis. In short, Supermetrics stands for Less Reporting, More Analysis.
Why Supermetrics?
Gathering information from different sources and combining them to display reports and graphs to our clients or organizations can be a tedious and time-consuming task. Let’s see how Supermetrics comes in handy in addressing our daily challenges as online marketers:
Integration With Major Marketing Platforms/ Multi-Channel Reporting
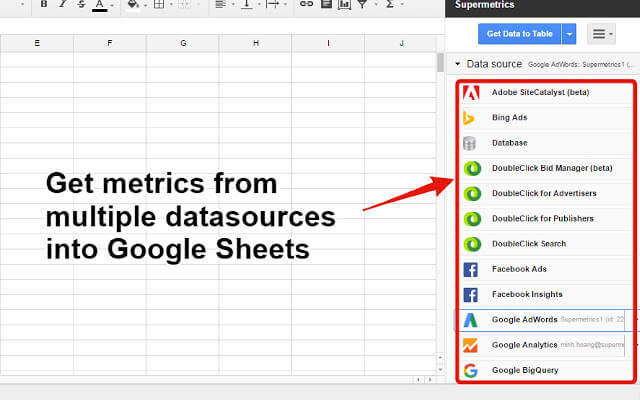
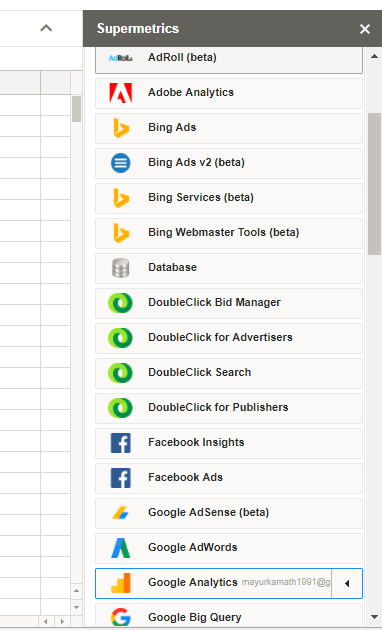
Supermetrics can be integrated with more than 40 platforms. Google Analytics, Google Ads, Facebook Ads and Insights, Bing Ads, Twitter are some of the common ones. It helps marketers to pull out data from multiple channels into a single view and, thus, make way for faster analysis. Along with different channels, it can also pull data from different accounts associated with the same channel, for comparison (different client accounts under the same channel). This is especially helpful when a client has multiple accounts for different locations and wants to track progress based on certain metrics for all the locations. What took hours earlier can now be done in under 5 minutes with Supermetrics.
No More Manual Copy/Pasting or Importing CSV Files
For marketers, time is money. Ironically, it’s time consuming to log into each platform every day and collect the data to be presented to our clients. Especially, if you are expanding to new channels, it will only increase the time consumed. Supermetrics makes the process much easier and faster with its highly flexible sidebar. Getting metrics for dozens of sites is just a matter of a few seconds as you only have to enter the required details and Supermetrics automatically fetches the data for you. This can save a lot of your precious hours and also improve the quality of presentation. Supermetrics promotes minimal maintenance and maximum observation, which means, the time used to prepare a report, can be used in delivering value to the client.
Save PPC Reporting Time
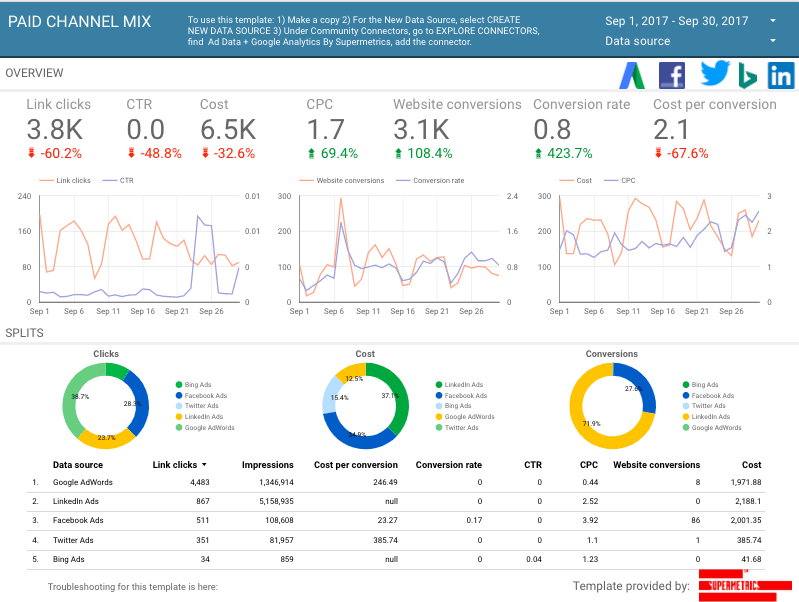
With increasing client base and marketing channels, data reporting and visualization has become more challenging and time-consuming than ever. Integrating data from different advertising channels into the same excel sheet, updating them daily and comparing the results is a tedious process. For example, if you’ve multiple accounts for Bing Ads, and also use different advertising platforms like Facebook Ads and Google Ads, the amount of complexity and time involved in daily reporting of the data can easily make you bang your head on the wall. This is where Supermetrics comes as the prophesized savior, especially with its Google Sheets Add-On feature and Google Data Studio integration. It helps to build the same excel report with all the data comparisons and complex charts, with all PPC channel data in the same place. With this, all the advertising data can be easily compared and the performance of one channel over the other can be analyzed almost effortlessly.
Track Your Daily Spend
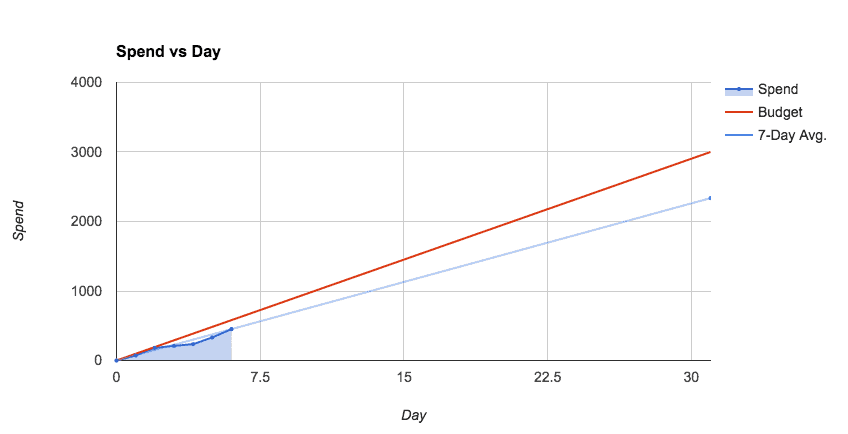
If you are involved in online advertising, you know the pain of tracking daily ad spends for every client to ensure maximum ROI. Once Supermetrics has pulled all the data on a spreadsheet, you can use data validation to create drop-downs and can flick through every client spend and how this is faring with the expected daily spend. This provides much more control over the tracking process and helps to quickly monitor all the client accounts. All you only have to do is select the required client account from the drop-down menu!
Automated Dashboards For Performance Tracking
To ensure high ROI for each client, you can set dashboards and automate alerts based on when the performance dips below the expected level. Any possibility of human error is, thus, eliminated by also ensuring client satisfaction. You can set alerts for performance, budgets and other metrics. For example, you can set an alert when the bounce rate goes beyond a certain limit. This allows you to identify the possible causes and take corrective action before it’s too late.
Supermetrics Features – How it Works
Data Analytics, Visualization, and Presentation
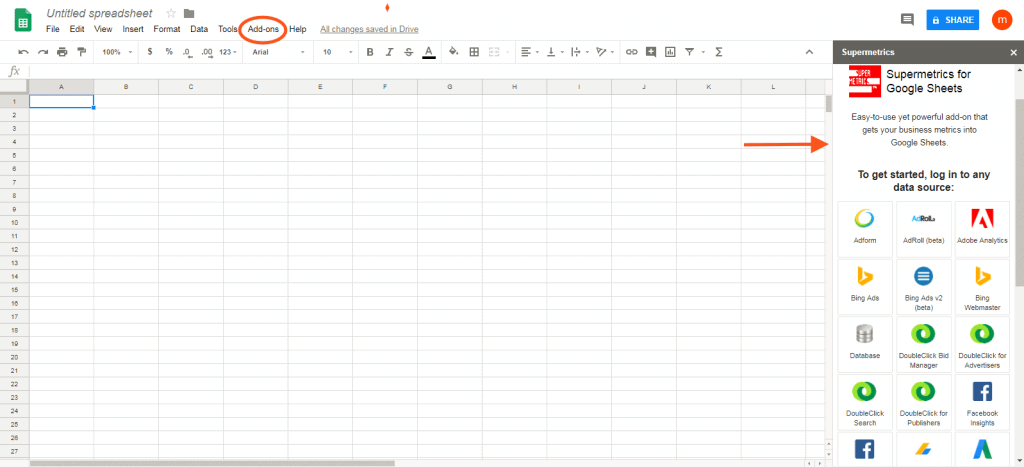
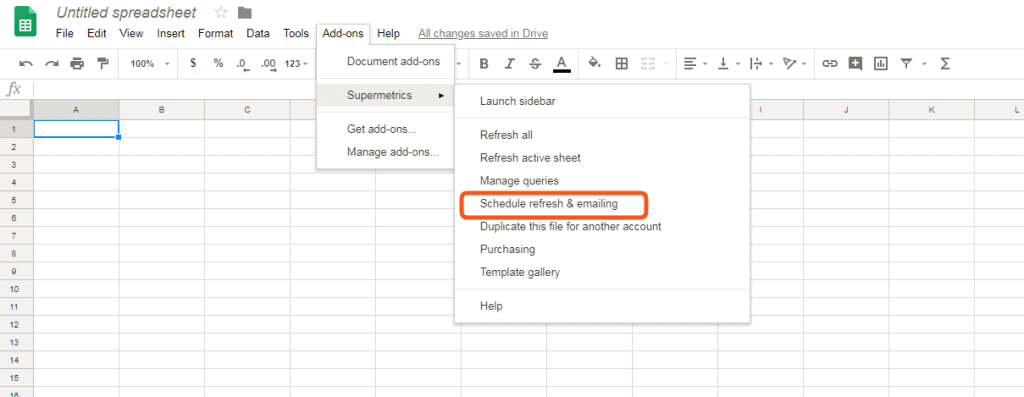
As you are already aware, Supermetrics comes with a Google Drive extension. If you’ve selected Google Sheets as the reporting format, then you can launch Supermetrics from the ‘Add-ons’ menu.
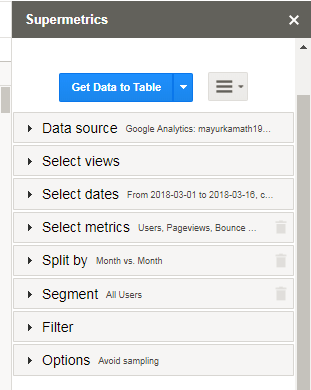
Once you’ve launched the sidebar, you can select from the required Data Source for which you want the data to be reported. It can be Google Analytics, Facebook Ads or any other channel.
Once you’ve selected the channel, you can click on ‘Select Views’ to choose any one, or multiple accounts which are to be analyzed. When you are done selecting the required accounts, you just have to choose the metrics you wish to analyze and Supermetrics will automatically fetch the required data for you.
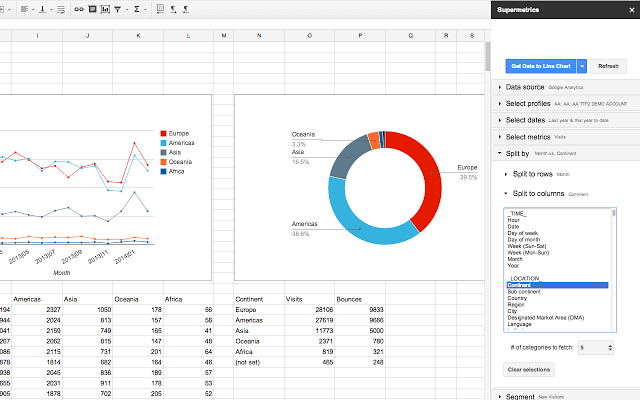
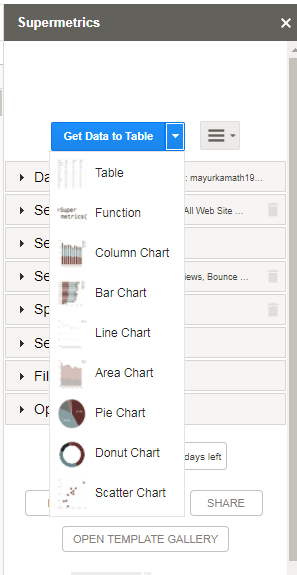
The data can be reported in Table Form or can be visualized as a Bar Graph, a Pie Chart or any other option of your choice.
Once the required data is fetched, Supermetrics automatically calculates how the numbers have changed over the week or month or even the past year for the same date range. So with Supermetrics you can get any metric you need, combine them with any dimensions and visualize them in any form you want.
Scheduled Refreshing and E-mailing
With the introduction of Supermetrics Google Sheets add-on, marketers are saved from enduring the pain of updating multiple reports for clients every day. While I had to save a chunk of time every day for this activity before, now, it happens automatically! Earlier, Supermetrics had grabbed a lot of attention with of its One-Click Refresh feature. You just had to click on the dashboard and data would be updated. Supermetrics has gone one step further with this feature by introducing scheduled refreshing and emailing. This ensures your data is always up-to-date by scheduling a daily refresh of queries. You no longer have to open the file and click the refresh button. To top it off, you can share the results by scheduling emails, which makes it simple to share with people who don’t use Google Docs.
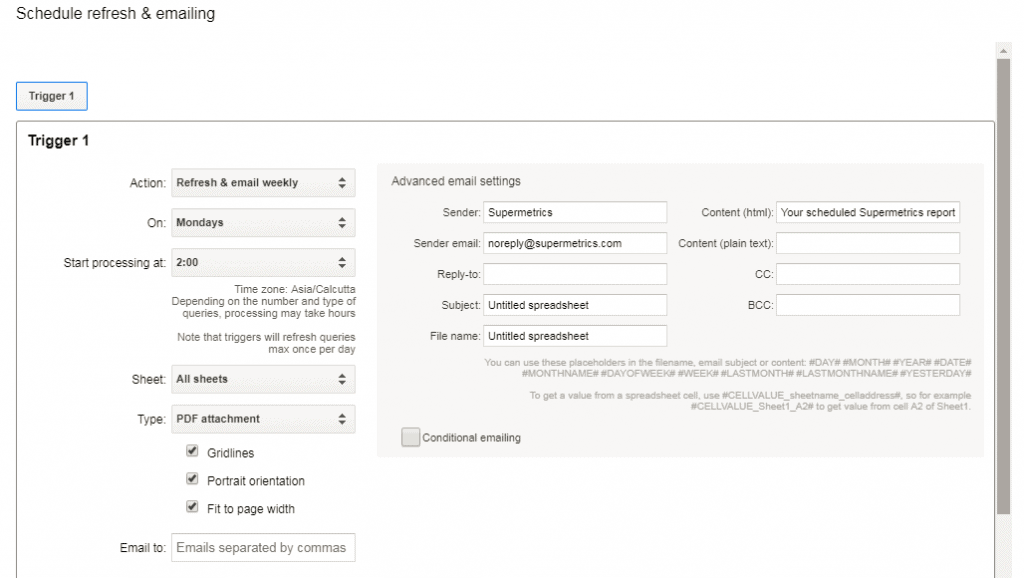
You can do this by setting up triggers. By clicking on the ‘Schedule refresh and emailing’ option under the add-on menu, you can choose daily/weekly/monthly refresh and email options and enter the destination email. You also have the flexibility to choose whether to email all worksheets or just one, send it as PDF or as an HTML table in the message body.
Ready-Made Templates
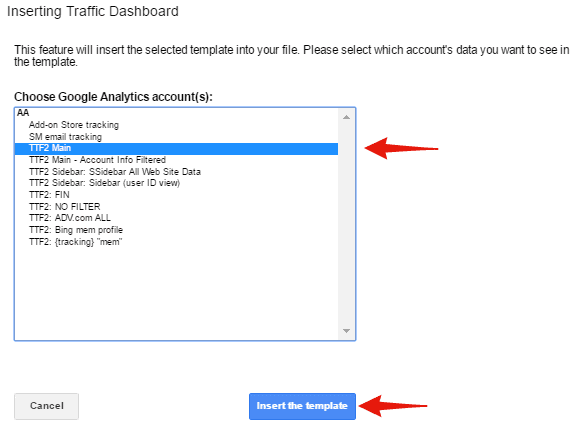
Supermetrics comes with a variety of templates handy for use and you can choose the one based on your choice of metrics and reporting style. Choosing a template is simple. Go to the drop-down menu Add-Ons> Supermetrics> Template Gallery. From there you can choose a template you desire and then select the account for which you want the data to be displayed. Then click on Insert Template.
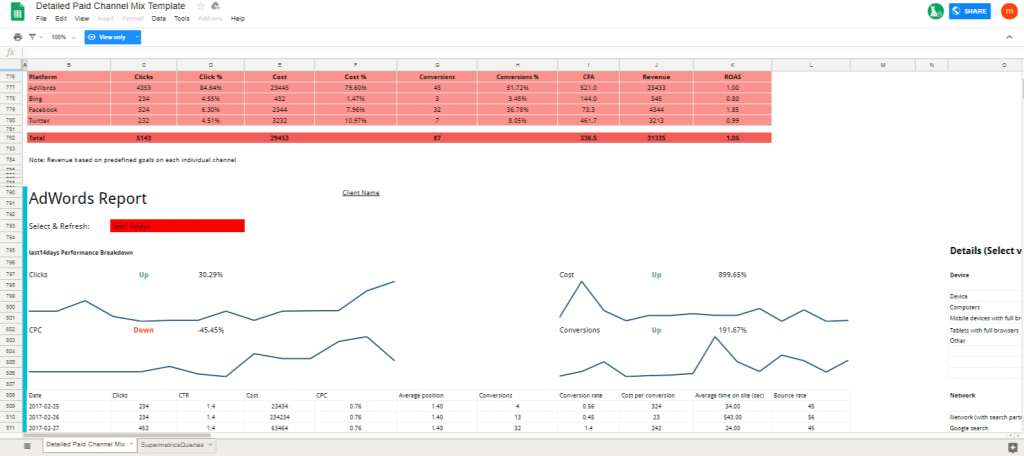
Once you are done, enjoy your colorful dashboard with the metrics you’ve chosen.
Manage Queries
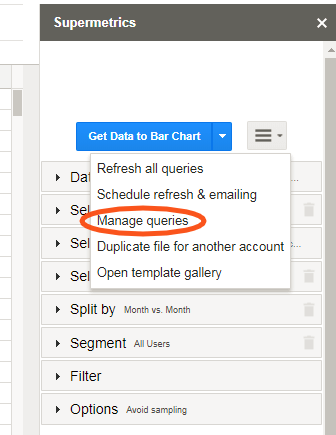
You can access this feature through the drop down from Add-ons menu (Add-ons>Supermetrics>Manage Queries), although it is much easier to modify or manage queries from the sidebar. The pro version allows a total of 1500 query executions per day and the Super Pro version allows 10,000 per day.
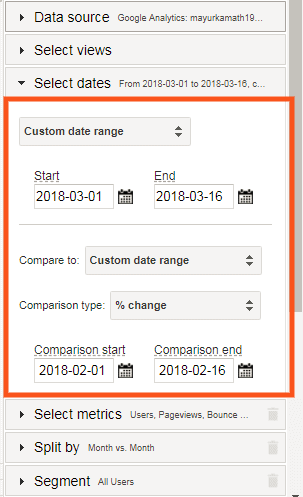
It is worth noting that each query may result in multiple requests to the data source API. If you experience any of the data sources hitting their daily limit, you can manage the query by either shortening the data ranges or by altering the metrics and dimensions to lighten the query load. The flexibility offered here is extremely helpful when a client asks for a month to date performance report compared to that of the previous month for the same date range. Such comparison is helpful in cases where the end of the month sales are to be tracked and analyzed every month.
Products and Pricing Structure
Supermetrics mainly has 2 products, namely Supermetrics for Google Sheets and Supermetrics for Google Data Studio. Supermetrics for Google Sheets is more commonly used for data analysis, whereas Supermetrics for Data Studio – for data visualization. Both have their own set of benefits and you can select the one that speaks more closely to your needs. So let’s review everything that Supermetrics has in store for us:
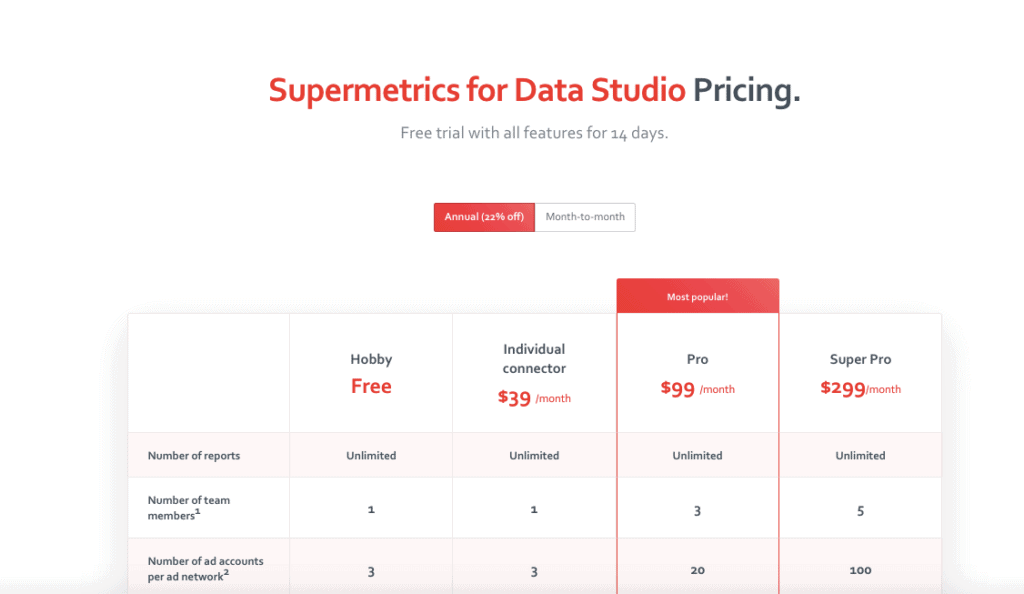
Supermetrics for Google Data Studio
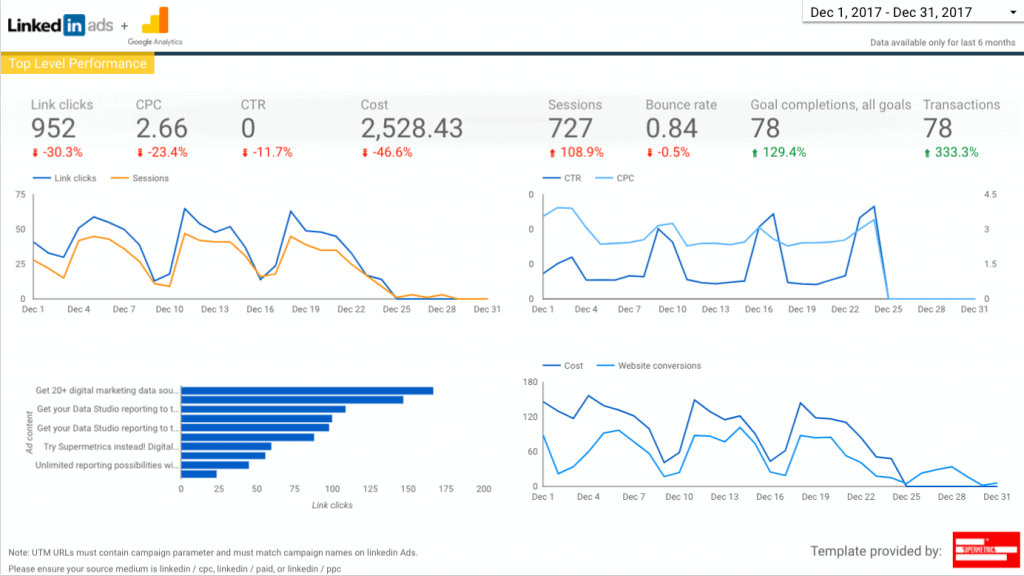
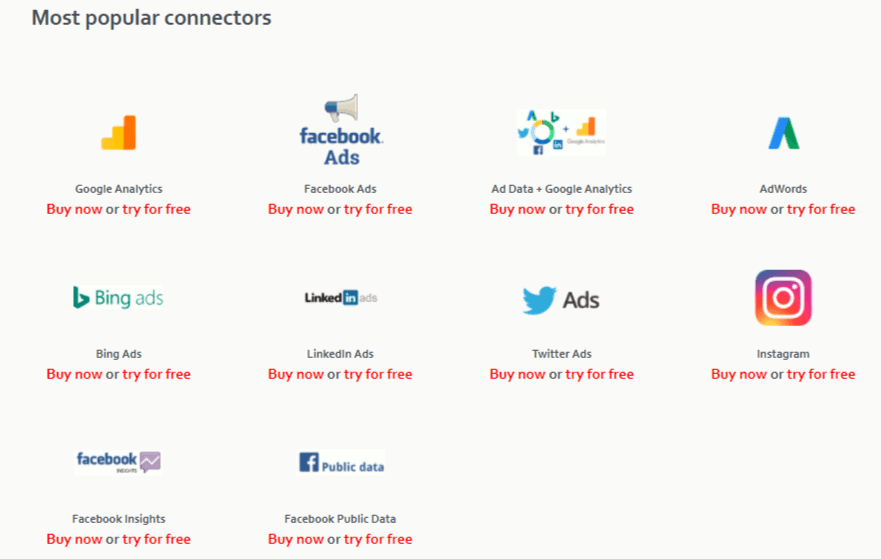
Data Studio is a great tool by Google for creating reports and, especially, for data visualization. To create reports or visualize data on Google Data Studio, you previously had to pull out data from Google Sheets and other selective data sources. However, the data from non-google sources had to be first organized in Google Sheets before importing it to Data Studio. Google Sheets is a great platform for creating reports. But, it is not perfect when it comes to importing data into Google Data Studio. For example, if you want to transfer date and time values from sheets to data studio, you must make sure the date and time formats are compatible with data studio- otherwise, they’ll be shown as text. Supermetrics solves this issue and makes the process much more breezy with its connectors for Google Data Studio. With the introduction of connectors like Facebook Ads, Twitter Ads, Bing Ads, LinkedIn Ads, MailChimp and 20+ sources altogether, it becomes incredibly simple to pull data and visualize them on Google Data Studio.
All of the connectors help to pull out data from multiple accounts of the same source together into the same report. You simply need to select all accounts while creating a data source on Google Data Studio. Monitoring spend and performance of multiple client accounts never got so easy. You can start with the 14-day free trial and check if the product is the right fit for you (No credit card required!). After the free trial, Supermetrics offers different plans based on your choice of connectors and desired features.
Start your 14-day free trial of Supermetrics for Data Studio (No credit card required)
Supermetrics for Google Sheets (or Google Drive)
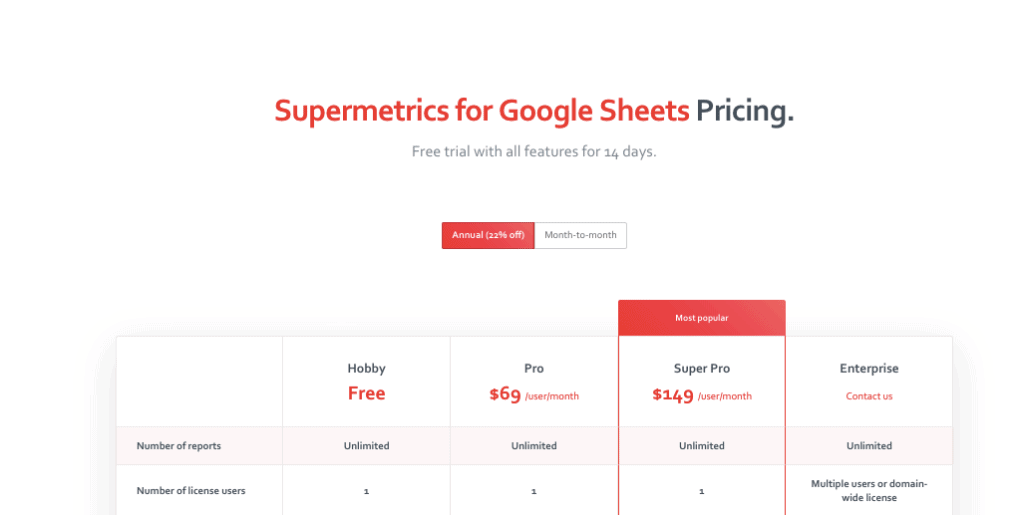
With Supermetrics for Google Sheets/Google Drive, you can automate the reporting process by automatically transferring all the data from different sources like Google Analytics, Facebook Ads, and Insights, Bing Ads, Google Ads, Twitter etc. with your choice of metrics onto a single spreadsheet or document.
The Pro version is offered at $69/user/month. It also offers a Super Pro version targeted at digital marketing agencies and organizations with a major focus on online marketing and is offered at $149/user/month. It gives access to Adobe Analytics, Adform, and DoubleClick and also has an ‘hourly refresh’ feature. Supermetrics offers a 14-day trial to thoroughly test the product and to see if you find it worth spending on. After the trial period, the free version can still be used but with limited access to Google analytics. Start your 14-day free trial of Supermetrics for Google Sheets (No credit card required)
Supermetrics Data-Grabber for Excel
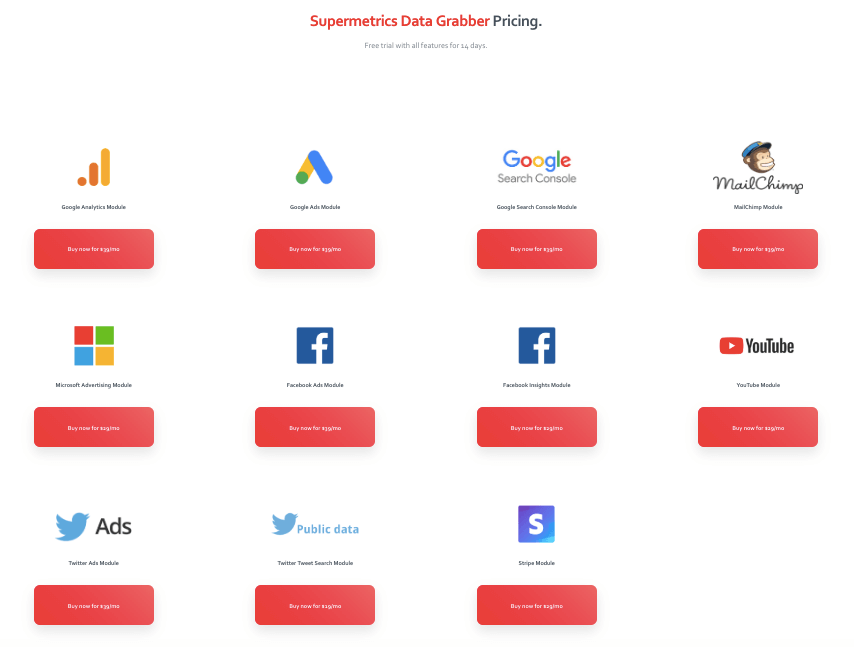
Marketers who are used to reporting on Excel, be it through the traditional CSV route or with Google API, can go with Supermetrics Data Grabber for Excel. Just like Supermetrics for Google drive, you can automatically import data from multiple sources into an Excel Spreadsheet and access all of its features. This product will equip you with the necessary firepower for creating quick and reliable Excel reports. It works with Windows Excel 2003 and later versions.
Data integration for each channel is offered at a different price range. Common platforms like Google Analytics and Google Ads cost $39/month.
Supermetrics Uploader
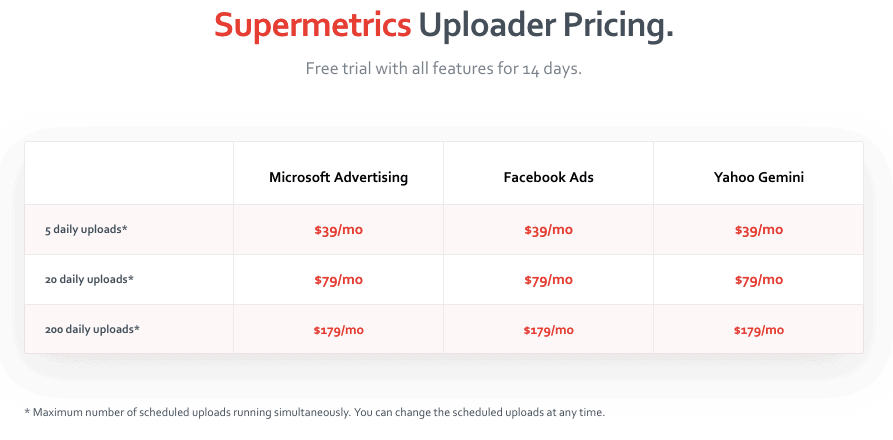
Supermetrics Uploader automatically imports data from different advertising channels into Google Analytics. You will have all the campaign spends in the same place and easily compare your ad spends on each channel with the results. With automatic updation of data, you can easily track your ROI on Google analytics.
The pricing starts at $39/month for each advertising channel and allows 5 scheduled uploads daily. Packs with $79/month and $179/month are also available that allow 20 and 200 daily uploads respectively.
Supermetrics Functions
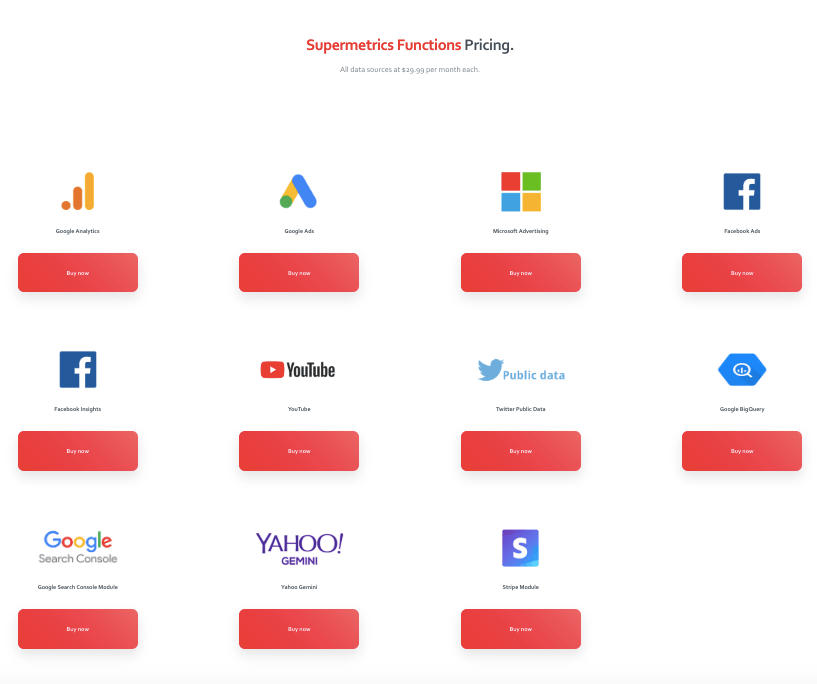
Supermetrics Functions is a product for skilled spreadsheet users who want complete control on how to display the data. You will be equipped with a custom function that you can type into the spreadsheet cells, just like any of the spreadsheet functions like SUM or COUNT and there are no programming skills required.
Supermetrics Functions is offered at a pricing of $29.99/month for each data source.
Final Words
Supermetrics is an all-round business intelligence software that is tailored to meet the specific needs of online marketers. It greatly simplifies the process of data analysis and through automation, saves a lot of our precious time. However, the use of the products depends on your overall ability to use spreadsheets. Also, sometimes there is a possibility of data getting pulled into the wrong columns (which can be solved by selecting the right columns and refreshing the query). So, you need to stay alert and proceed with analysis only if the data makes sense to you. The downsides are minor when compared to the amazing benefits offered by Supermetrics. With its flexibility and frequent updates, Supermetrics provides the required edge that is vital to the growth of an agency or organization. For now, you can start using Supermetrics with the free trial and get used to the interface, before you can make a buying decision. With features like easy integration with multiple data sources, ease of data visualization and real time data analysis, Supermetrics is a must-have tool in every online marketer’s toolbox. Start Your Free Trial of Supermetrics with Access to All Features (No Credit Card Required)
Briefcase Review: The Ultimate Business Growth Package by AppSumo SEO Tools Showdown: SEMrush vs Ahrefs vs Moz Pro vs SpyFu 14 Best Google Chrome Extensions for SEO Instapage Review: Landing Page Software for Agencies and Bloggers
